
Graphite and Grafana: Visualizing Application Performance
MP4 | Video: AVC 1280x720 | Audio: AAC 44KHz 2ch | Duration: 1 Hour 49M | 202 MB
Genre: eLearning | Language: English
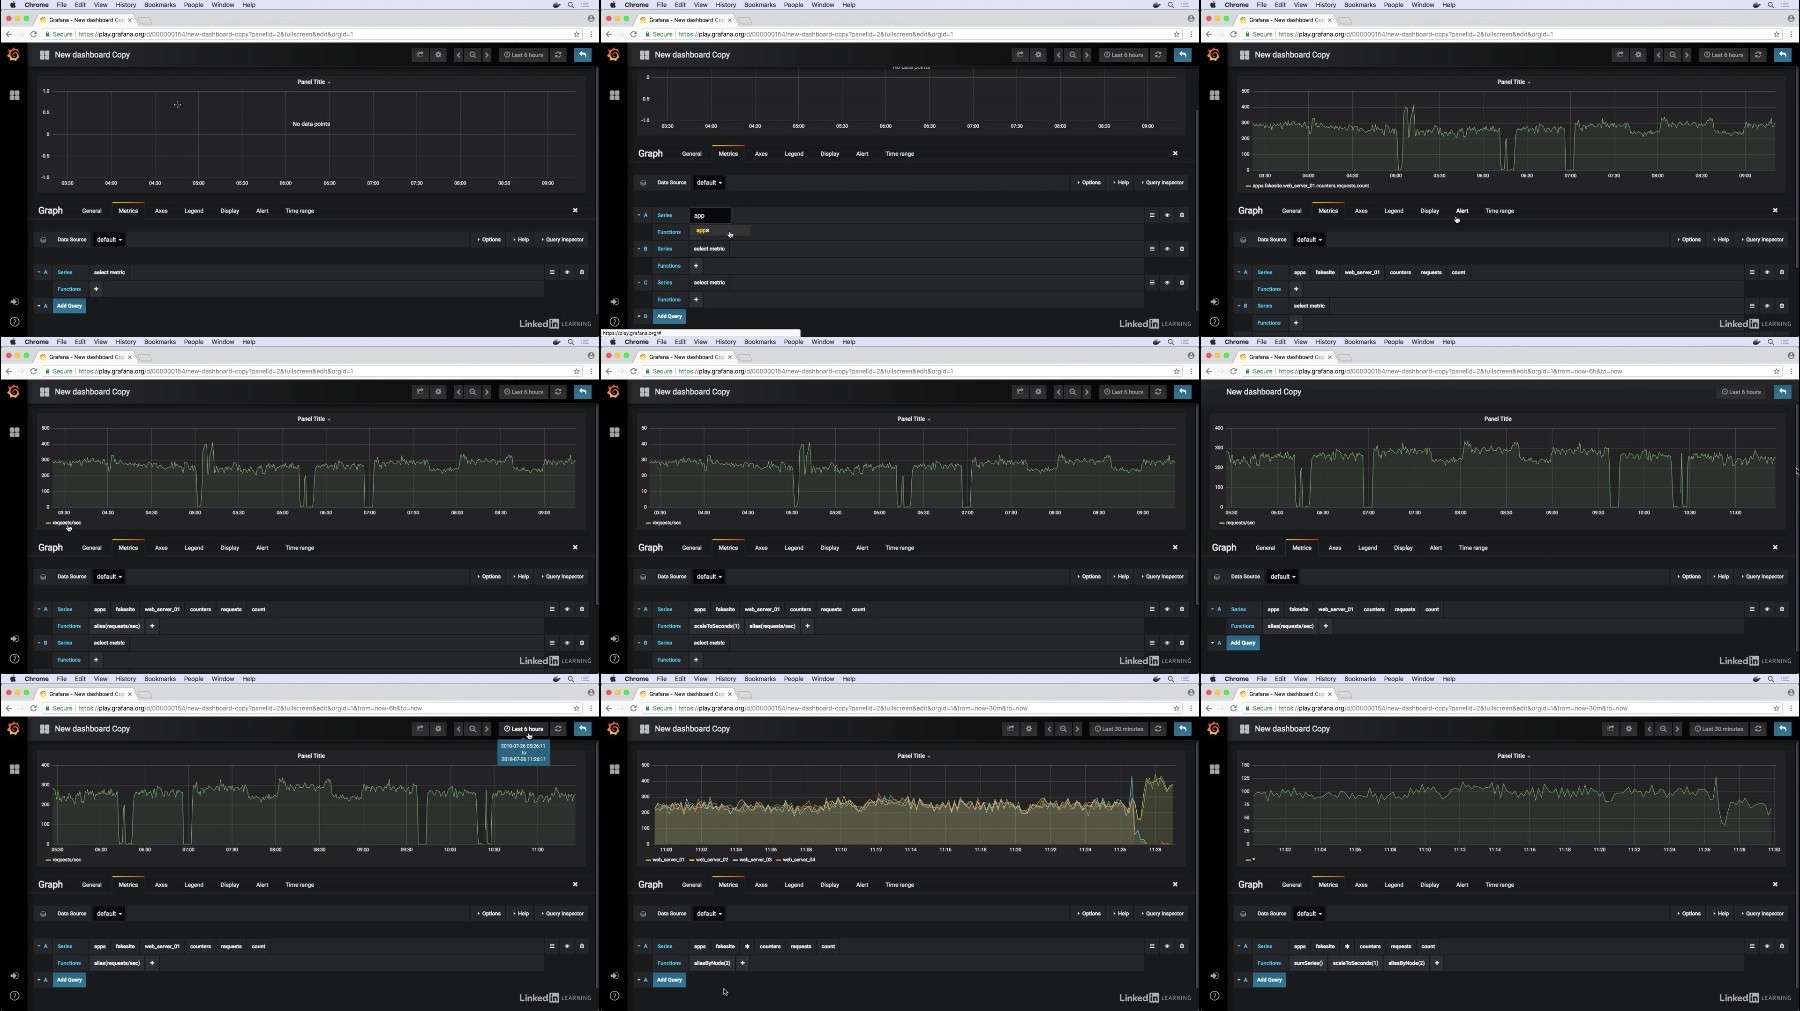
Get better insights into your back-end performance—whether your applications run on site or in the cloud. StatsD, Graphite, and Grafana are three popular open-source tools used to aggregate and visualize metrics about systems and applications. This course shows how to use them in combination to stay on top of outages, diagnose issues related to database and server performance, and optimize your user experience. Instructor Laura Stone—a senior-level site reliability engineer—explains how to gather app-specific metrics with StatsD, store those metrics efficiently with Graphite, and monitor and beautifully visualize this information with Grafana. Follow along to learn how to install, configure, and use these tools to create informative, useful dashboards that provide insights into multiple applications and systems—deepening your understanding of the performance and business value of your organization's architecture.
RapidGator
AlfaFile
TurboBit
We need your support!
Make a donation to help us stay online

Bitcoin (BTC)
bc1q08g9d22cxkawsjlf8etuek2pc9n2a3hs4cdrld

Bitcoin Cash (BCH)
qqvwexzhvgauxq2apgc4j0ewvcak6hh6lsnzmvtkem

Ethereum (ETH)
0xb55513D2c91A6e3c497621644ec99e206CDaf239

Litecoin (LTC)
ltc1qt6g2trfv9tjs4qj68sqc4uf0ukvc9jpnsyt59u

USDT (ERC20)
0xb55513D2c91A6e3c497621644ec99e206CDaf239

USDT (TRC20)
TYdPNrz7v1P9riWBWZ317oBgJueheGjATm